Homelab
For 2 years, I started building myself a homelab, to be able to host applications for myself and to have infra at hand to try new technologies and concepts before using them at work. It has become a mix of "Home prod", Devops lab, with heavy "Prepper" vibes.
My approach is to get as close to the experience I have deploying applications to a cloud provider, and ensure that I can have some redundancy, data backups and high availability, in the limit of the hardware I have at my disposal. I don't want a fully air gapped setup, but I want to rely only on external resources for artifacts (code deps, images, helm charts), as I don't currently want to mirror everything in a private registry.
I like to work with kubernetes, but I don't want my whole stack to rely on it. I need some devops tools to store my code, bootstrap and manage the kubernetes environment. So I went with the following abstraction layers.
physical nodes --> proxmox cluster --> kubernetes cluster
This allows me to have some VMs and LXCs next to kubernetes, to manage the whole thing.
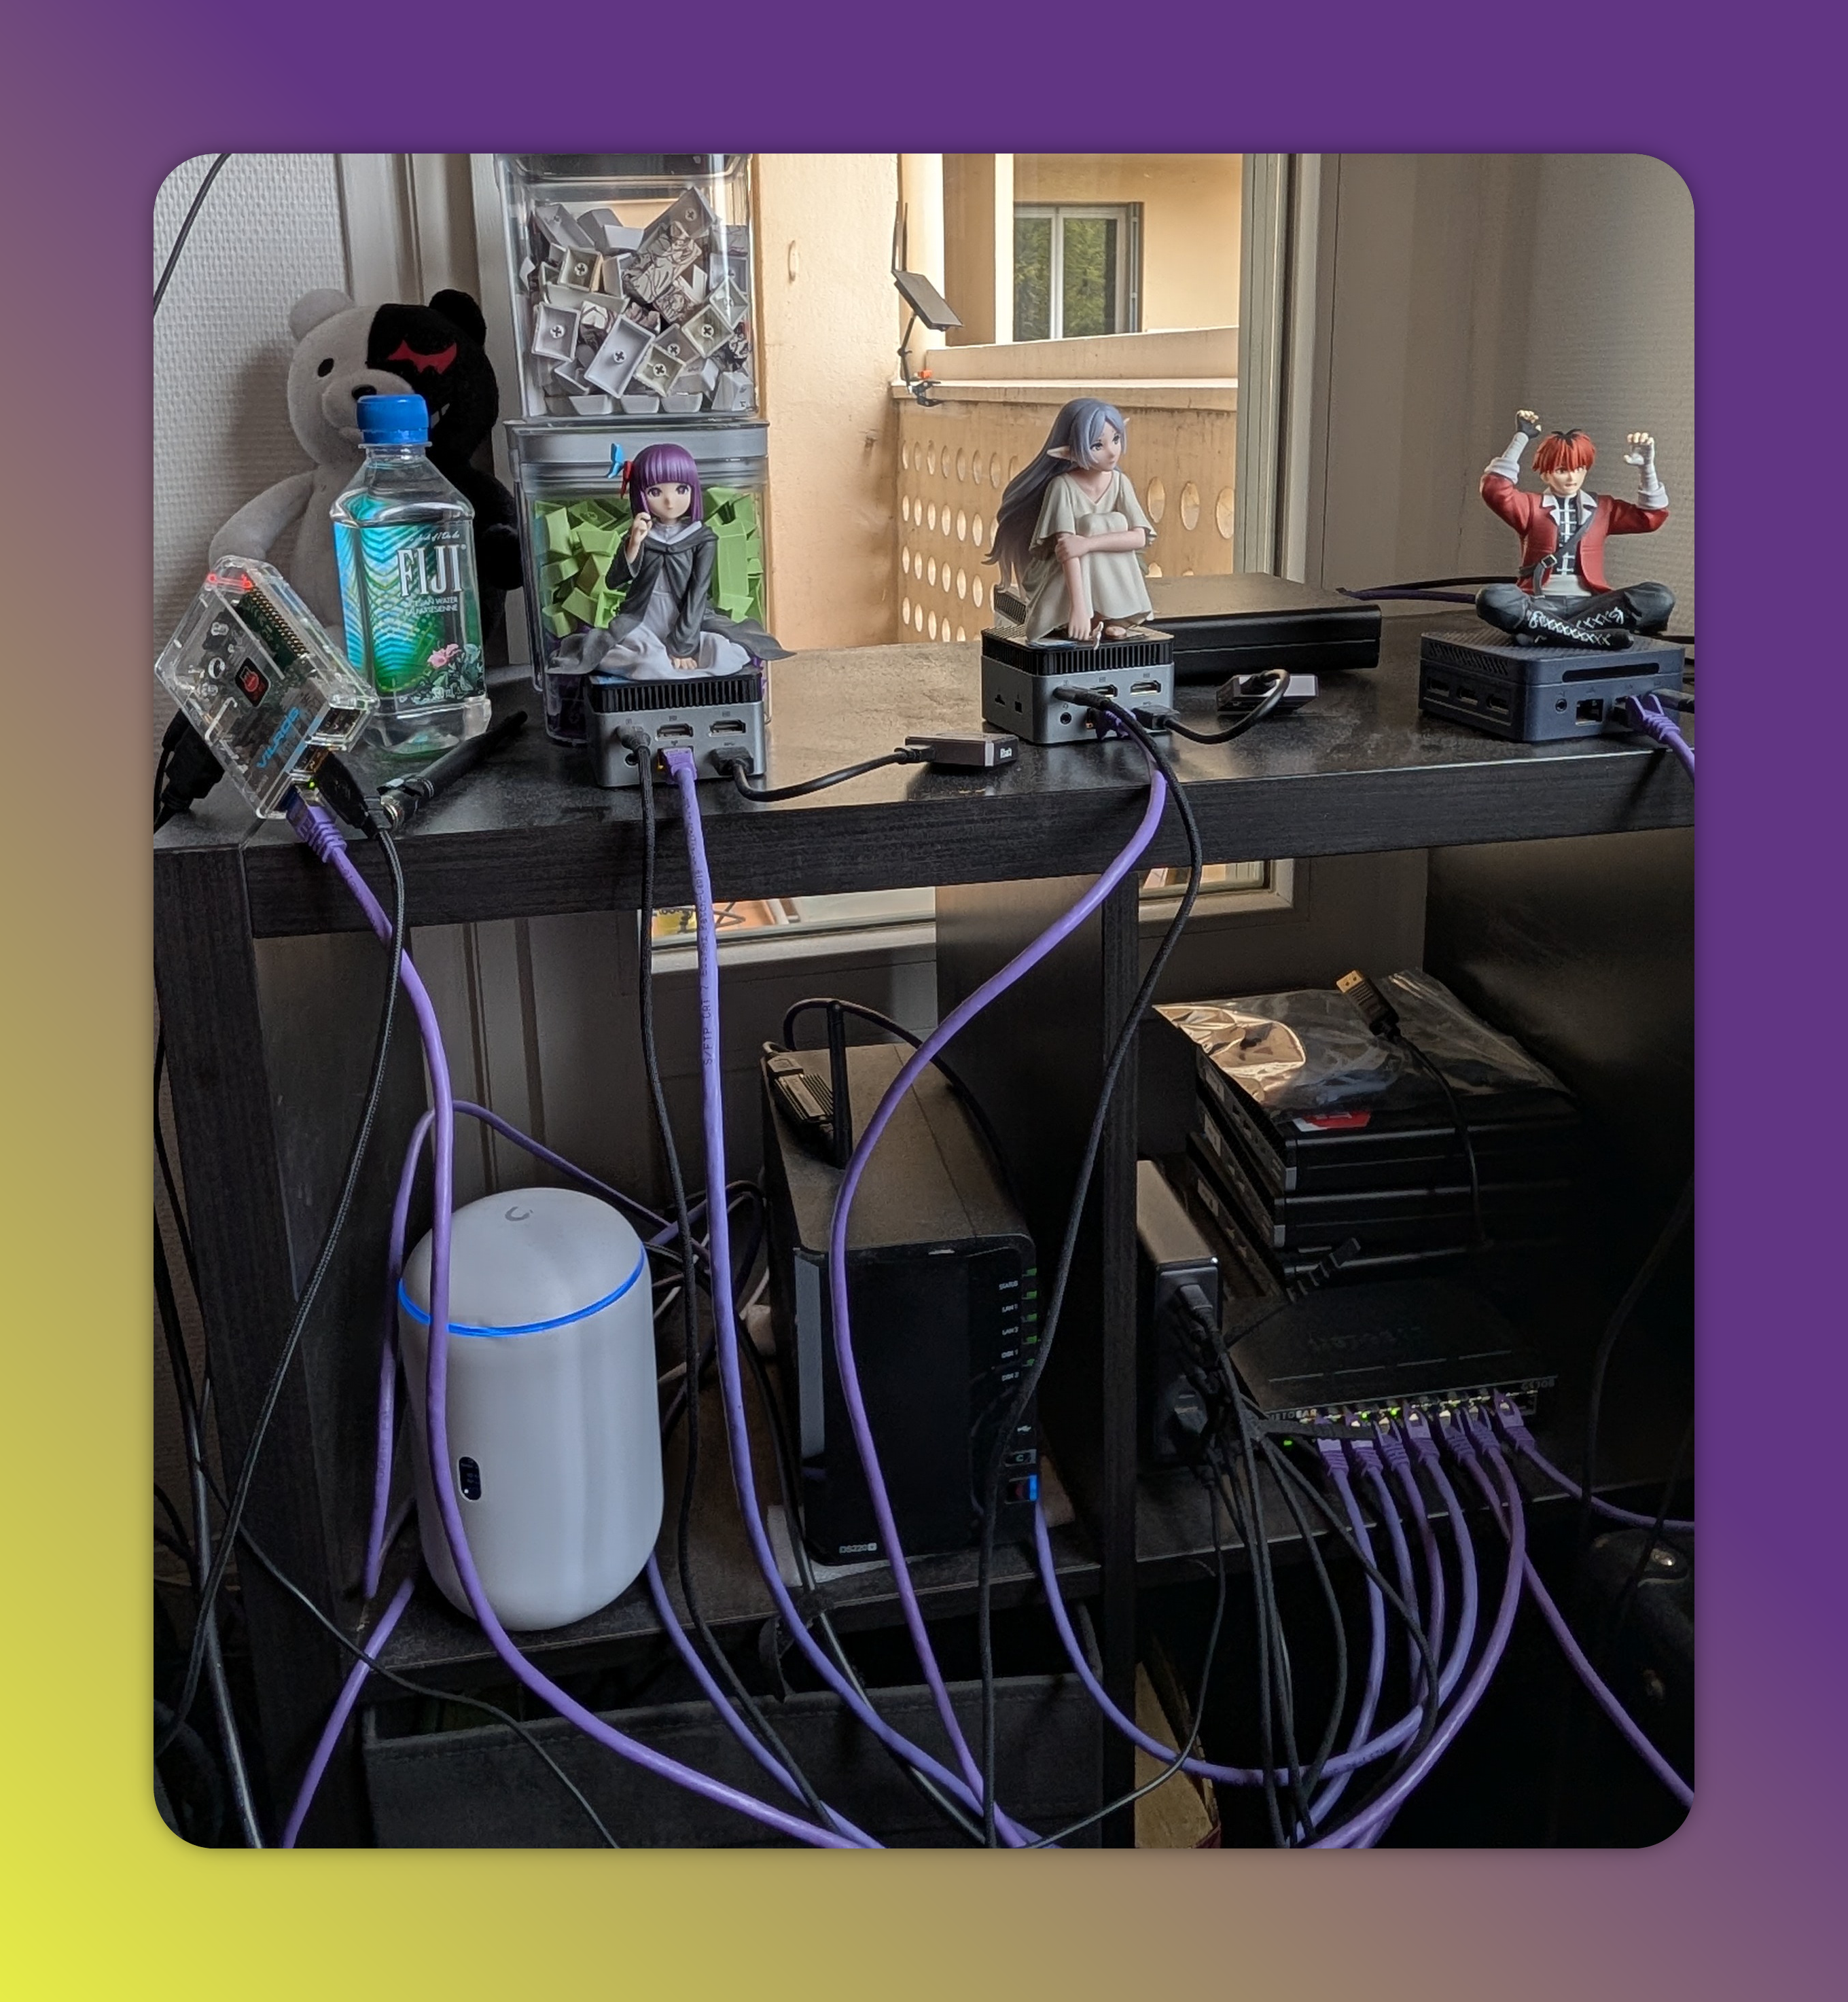
Hardware - aka cable mess
Here is a physical view of my setup.
flowchart TD
ISP[ISP box]
subgraph home
    UDR7
    NAS@{ shape: disk, label: "Synology NAS" }
    subgraph lan-default[LAN default]
       dev@{ shape: processes, label: "personal devices"}
    end
    subgraph lan-proxmox[LAN proxmox]
        direction TB
        node1[gmktek n97]
        node2[gmktek n97]
        node3[mllse n150]
        node4[hp g3 400]
        ceph1@{ shape: disk, label: "1TB"}
        ceph2@{ shape: disk, label: "ceph2"}
        ceph3@{ shape: disk, label: "ceph3"}
    end
    subgraph lan-iot[LAN IoT]
        iot@{ shape: processes, label: "IoT devices"}
    end


end
ISP <-->|2.5Gb| UDR7
UDR7 <-->|1Gb| lan-default
UDR7 <-->|1Gb| lan-proxmox
UDR7 <-->|1Gb| lan-iot
NAS <-->|1Gb| lan-proxmox
NAS <--> |2.5Gb| UDR7
NAS <-.->|1Gb vlan| lan-default
node1 <-->|usb| ceph1
node2 <-->|usb| ceph2
node3 <-->|usb| ceph3
My initial goal was to get completely rid of my ISP's box. But I gave up on the idea as I had issues finding the right ONT SFP plug (optic fiber), proprietary VLAN, PPPoE config. And frequent internet loss were not an option in my household...
The NAS is a Synology DS220+, with 2x4TB storage in raid1.
One day I plan to switch to a homemade machine with TrueNAS, but I will wait for the Synology to be full before switching.
Hosts list
| hostname | model | cpu | ram | drive |
|---|---|---|---|---|
| frieren | GMKTek N97 | 4 Cores | 12 GB | 120GB + 1TB for ceph |
| fern | GMKTek N97 | 4 Cores | 12 GB | 120GB + 1TB for ceph |
| stark | MLLSE N150 | 4 Cores | 12 GB | 120GB + 1TB for ceph |
| eisen | HP Prodesk g3 400 | 6 Cores | 16 | 70GB |
| Total | 18 CPU | 50GB | 2.7TB for Ceph |
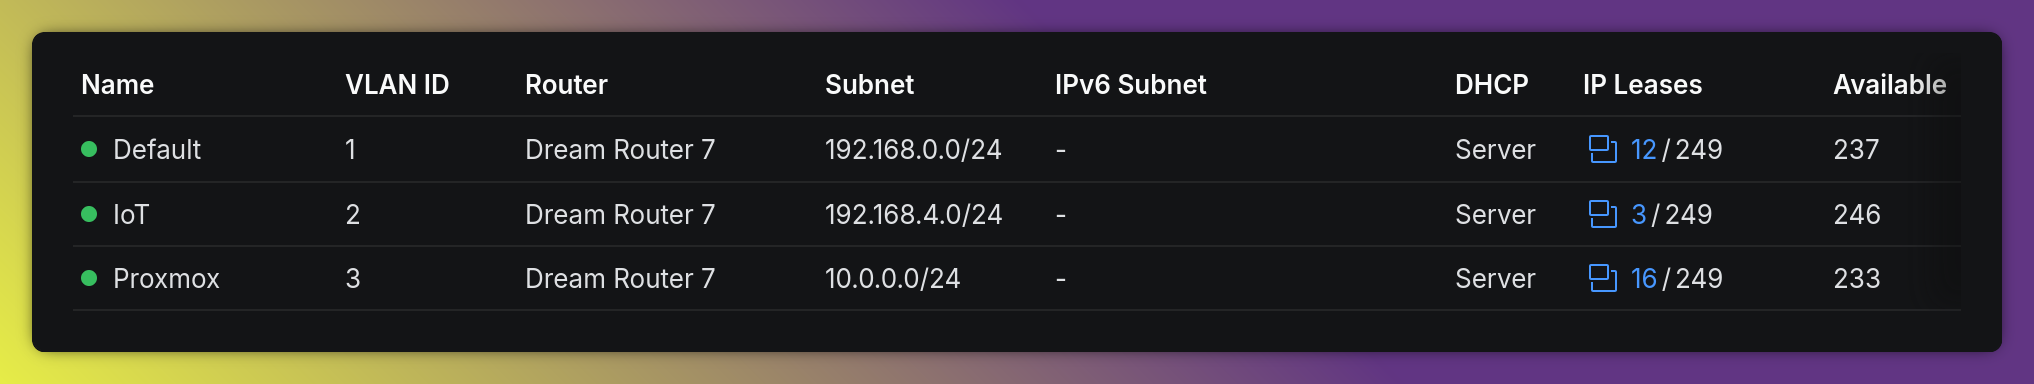
Networking
Topology
All my networking is handled by the Ubiquiti UDR7, it handles:
- LAN management
- sees my ISP's box as a WAN
- DNS resolution
- DHCP
- firewall policies
All that done through the UniFi portal, hosted on the thing.
My lan topology is as following
DNS
I use home.com as local domain. All physical nodes have a static ip and an associated DNS record frieren.home.com, stark.home.com or nas.home.com
Proxmox vms also have static ips and DNS forgejo.home.com or docker.home.com
And finally, I attach a wildcard record for the kubernetes Gateway API IP *.k8s.home.com, so that I don't have to manage records for all my k8s hosted apps.
Firewall & Security
I have a few basic rules, - Geoblocking every inbound that is not from France on all traffic. - Blocking IoT network outbound to anywhere. - DNS ad blocking, stock from the dream router (this replaces a PyHole/AD-GUARD) - Protocol blocking of Peer-to-peer, so I don't accidentally torrent linux ISOs without a VPN.
I have only 2 ports opened to the internet - The UDR7 OpenVPN port, so I can connect remotely to my LAN. - Homeassistant, through NAT and port mirroring, to be able to access it from home assistant's android app from anywhere.
I know that my networking is not too open source oriented, as i am vendor locked to ubiquiti devices and features. But the price per feature is great. Maybe i will go a more open route some day.
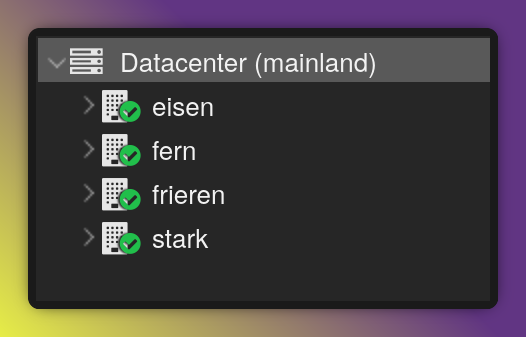
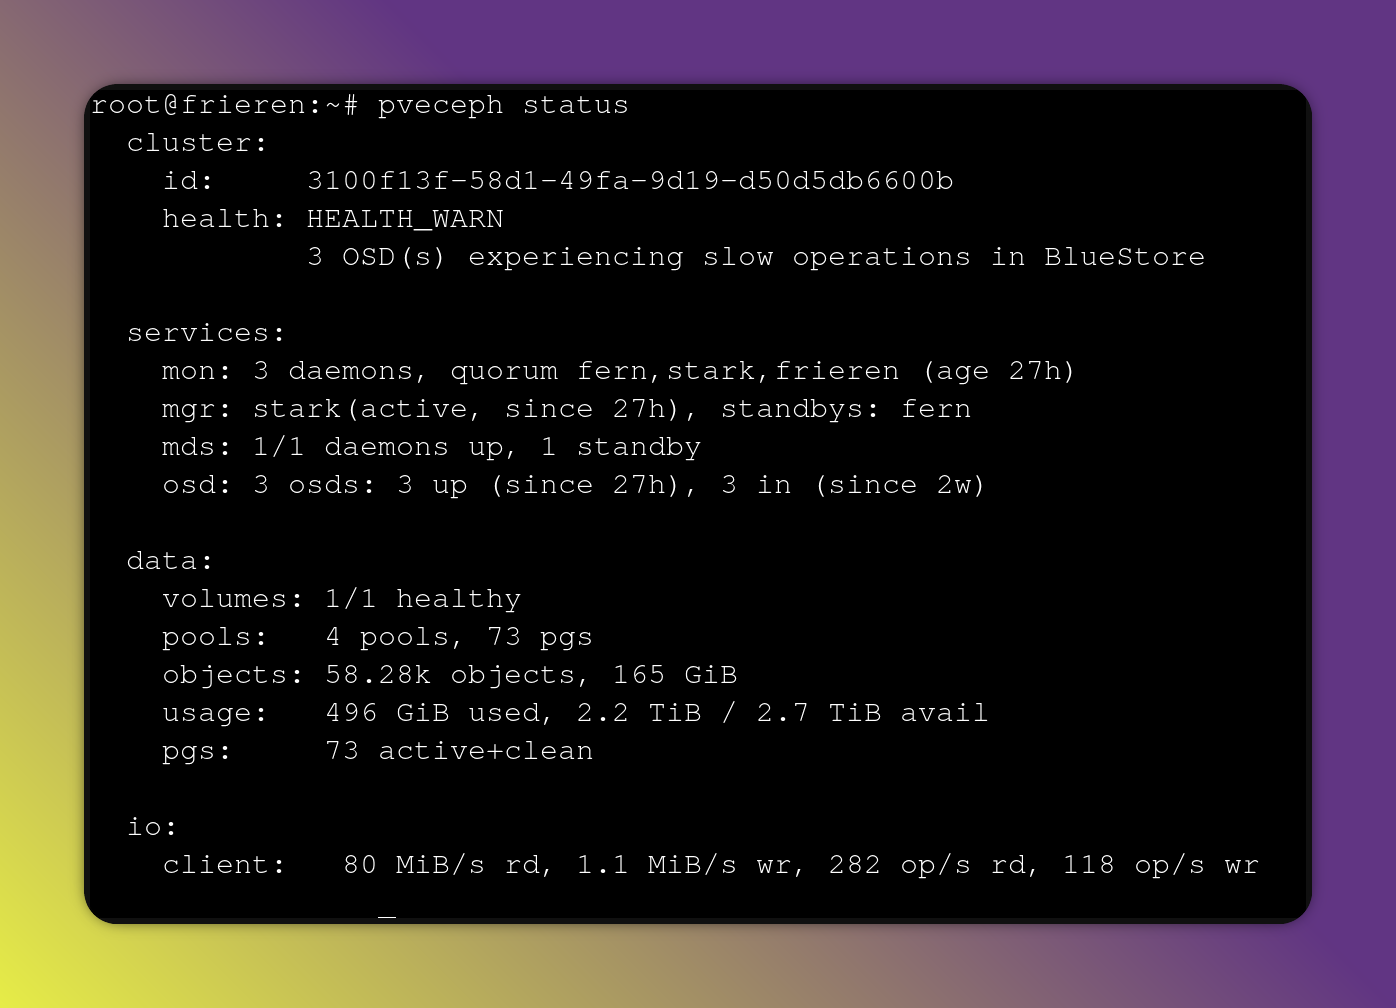
Virtualisation & Storage - Proxmox
All 4 physical nodes join the same PVE cluster.
3 of the nodes have an additional 1TB drive attached to them, that are used with PVE integrated ceph.
Ceph is a great distributed storage solution, and having it separated over 3 nodes means that I can safely lose a physical node and disk and be able to rebuild the data.
This Ceph pool is accessible from all 4 PVE nodes, and used for VM disk provisioning.
All PVE nodes also have an NFS volumes mounted from the NAS. These are used either on RW volumes to store backups, or on read only volumes to access media that is on the NAS.
On my first iteration of the lab, I was using the NAS as SAN to mount iscsi luns for the VM disks and even for kubernetes pvcs, but it was a pain to manage, and slow because of the HDDs on the NAS.
For important VM backups, I added a Proxmox Backup Server (PBS) instance, to handle the snapshotting of VMs with minimal storage footprint, on an NFS volume on the NAS. The PBS runs as an LXC on proxmox itself. That LXC is not backed up, but I don't plan on it to fail.
Devops stack - Forgejo
Once we have virtualisation and storage, we are good to go. For devops purpose, I wanted to be able to store code, run pipelines and store custom container images. The simplest solution I found was Forgejo. As I prefer github action style pipelines to gitlab components. I have a Forgejo LXC, and next to it, a docker VM that hosts the Forgejo runner for the pipelines. This docker VM also hosts a minio, that I used for s3 style terraform states storage.
flowchart LR
subgraph Forgejo
repos
registries
actions
end
subgraph docker
  runner
end
actions -->|runs on| runner
From Forgejo, I am able to run open tofu in pipelines, to provision infrastructure to proxmox.
Kubernetes - Talos
Now that I can manage some infra, I was able to start building my main platform, the kubernetes cluster. I chose to go with Talos, as it is easy to setup and maintain.
In the first version of the lab, I was running a baremetal k3s cluster, but this meant having all 3 control plane physical nodes running at all times, and left me no spare compute for other use.
To have high availability, I deploy 3 control plane Talos nodes (you either have 1 or 3+, because of quorum), that are each on different proxmox nodes.
And then I deploy 3 worker talos nodes, on the same PVE node, the one with the most RAM. If this one fails, the worker VMs will be able to move to other PVE nodes. Using proxmox HA.
All these are deployed using terraform, for the init. And on a day to day basis, i use talosctl to manage the day 2 actions, updating nodes / api.
# Terraform module for the cluster
module "cluster1" {
  # source = "github.com/bbtechsys/terraform-proxmox-talos"
  source = "./modules/talos"

  talos_cluster_name = "talos-k8s-cluster"

  talos_version = "1.11.2"
  control_nodes = {
    "node-control-1" = "fern"
    "node-control-2" = "frieren"
    "node-control-3" = "stark"
  }
  control_machine_config_patches = [
    <<-EOT
    - op: add
      path: /cluster/network
      value:
        cni:
          name: none
    EOT
  ]
  worker_nodes = {
    "node-worker-1" = "eisen"
    "node-worker-2" = "eisen"
    "node-worker-3" = "eisen"
  }
  worker_machine_config_patches = [
    <<-EOT
    - op: add
      path: /cluster/network
      value:
        cni:
          name: none
    EOT
  ]
  proxmox_iso_datastore     = "vm-pv"
  proxmox_image_datastore   = "ceph-vm-storage"
  proxmox_control_vm_cores  = 2
  proxmox_worker_vm_cores   = 2
  proxmox_worker_vm_memory  = 4096
  proxmox_control_vm_memory = 4096
}
This runs on Forgejo Actions 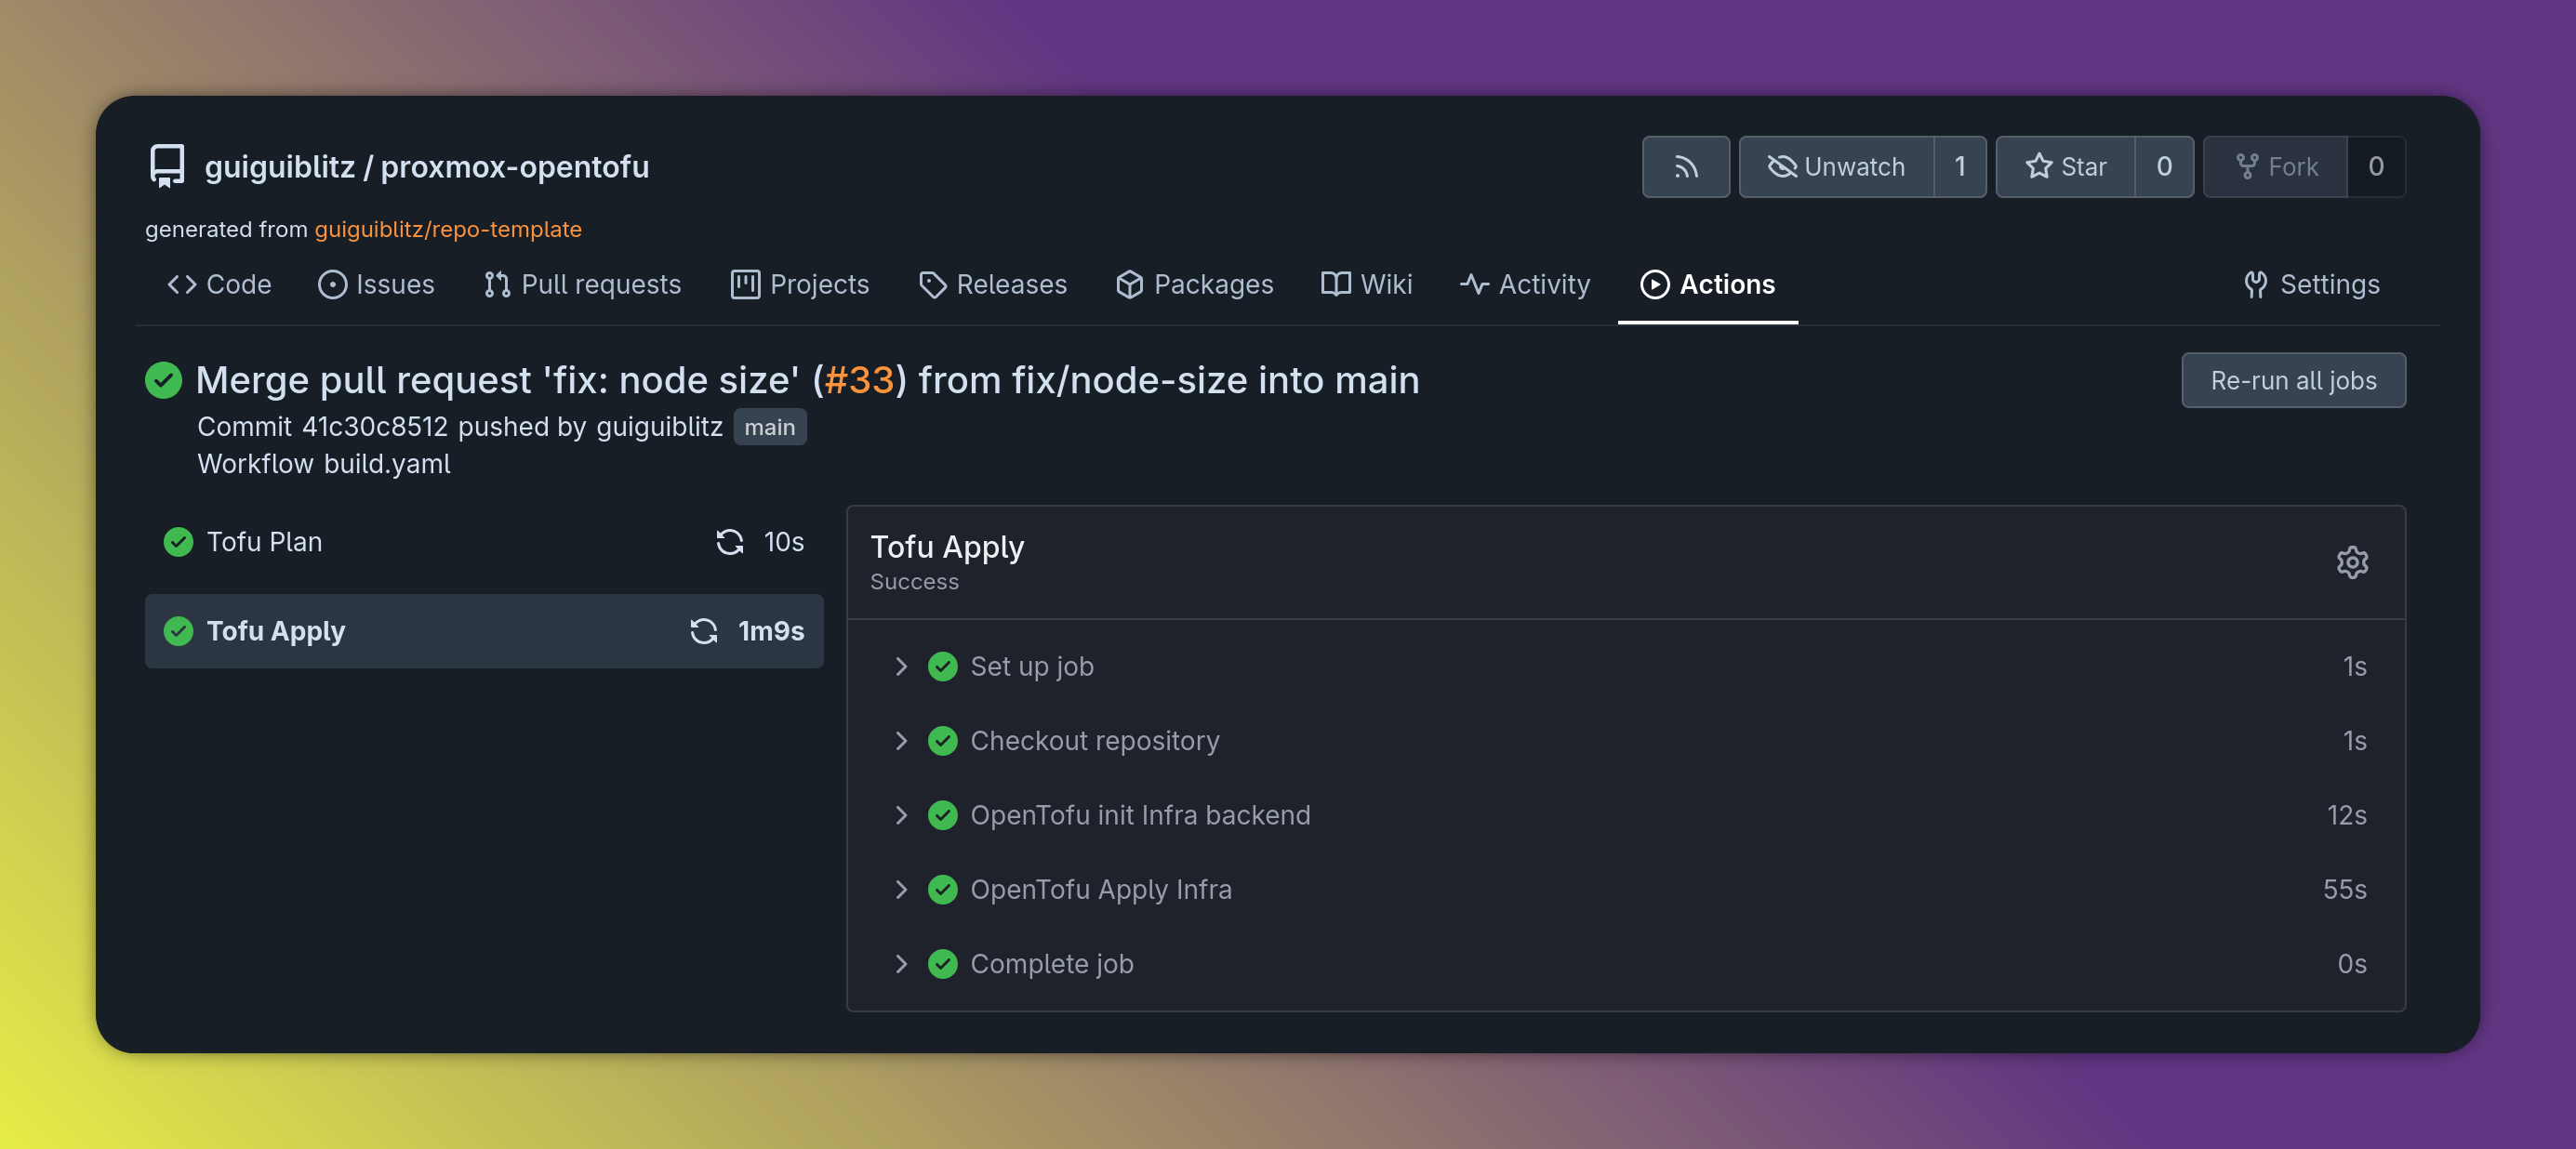
Here is a view of a talos node from talosctl dashboard
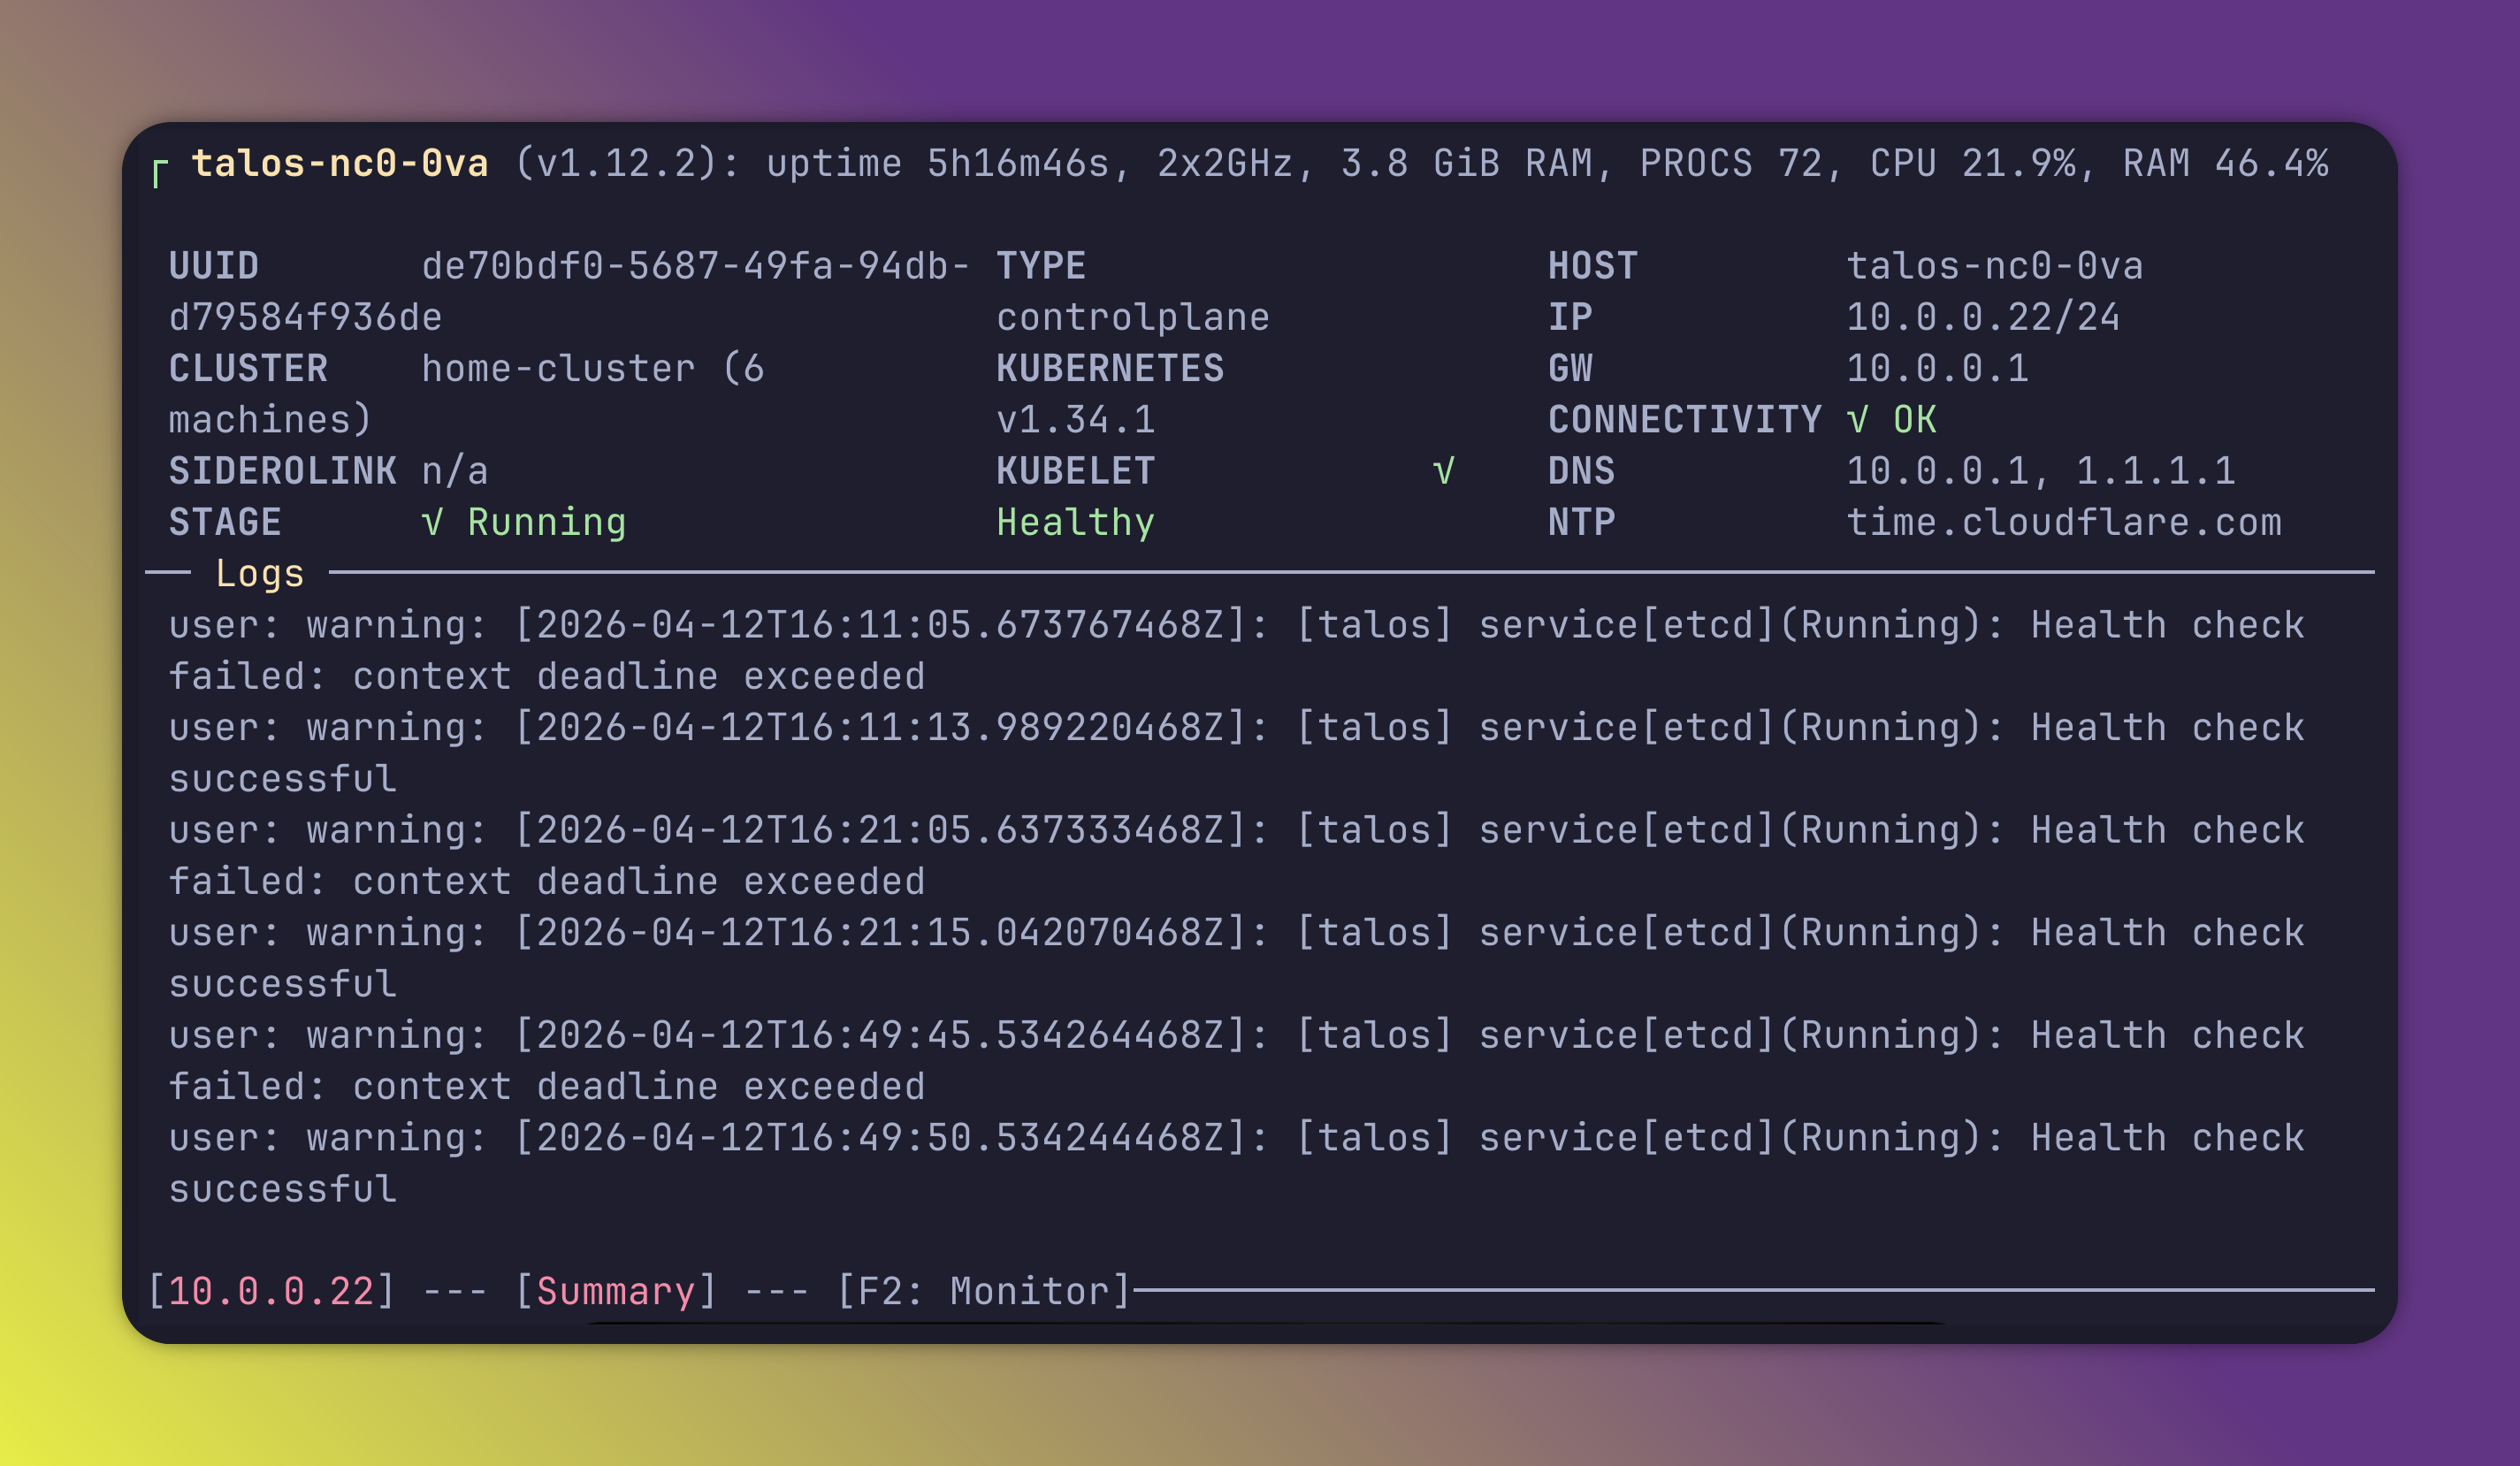
If I had to do it again, I would have looked at setting up the cluster through Cluster API from a k0s or something, instead of terraform. But I didn't have the knowledge at the time.
The clusters use Cilium as CNI.
When installing Talos make sure to build an image with the Qemu addon, otherwise they cannot run on Proxmox virtualisation.
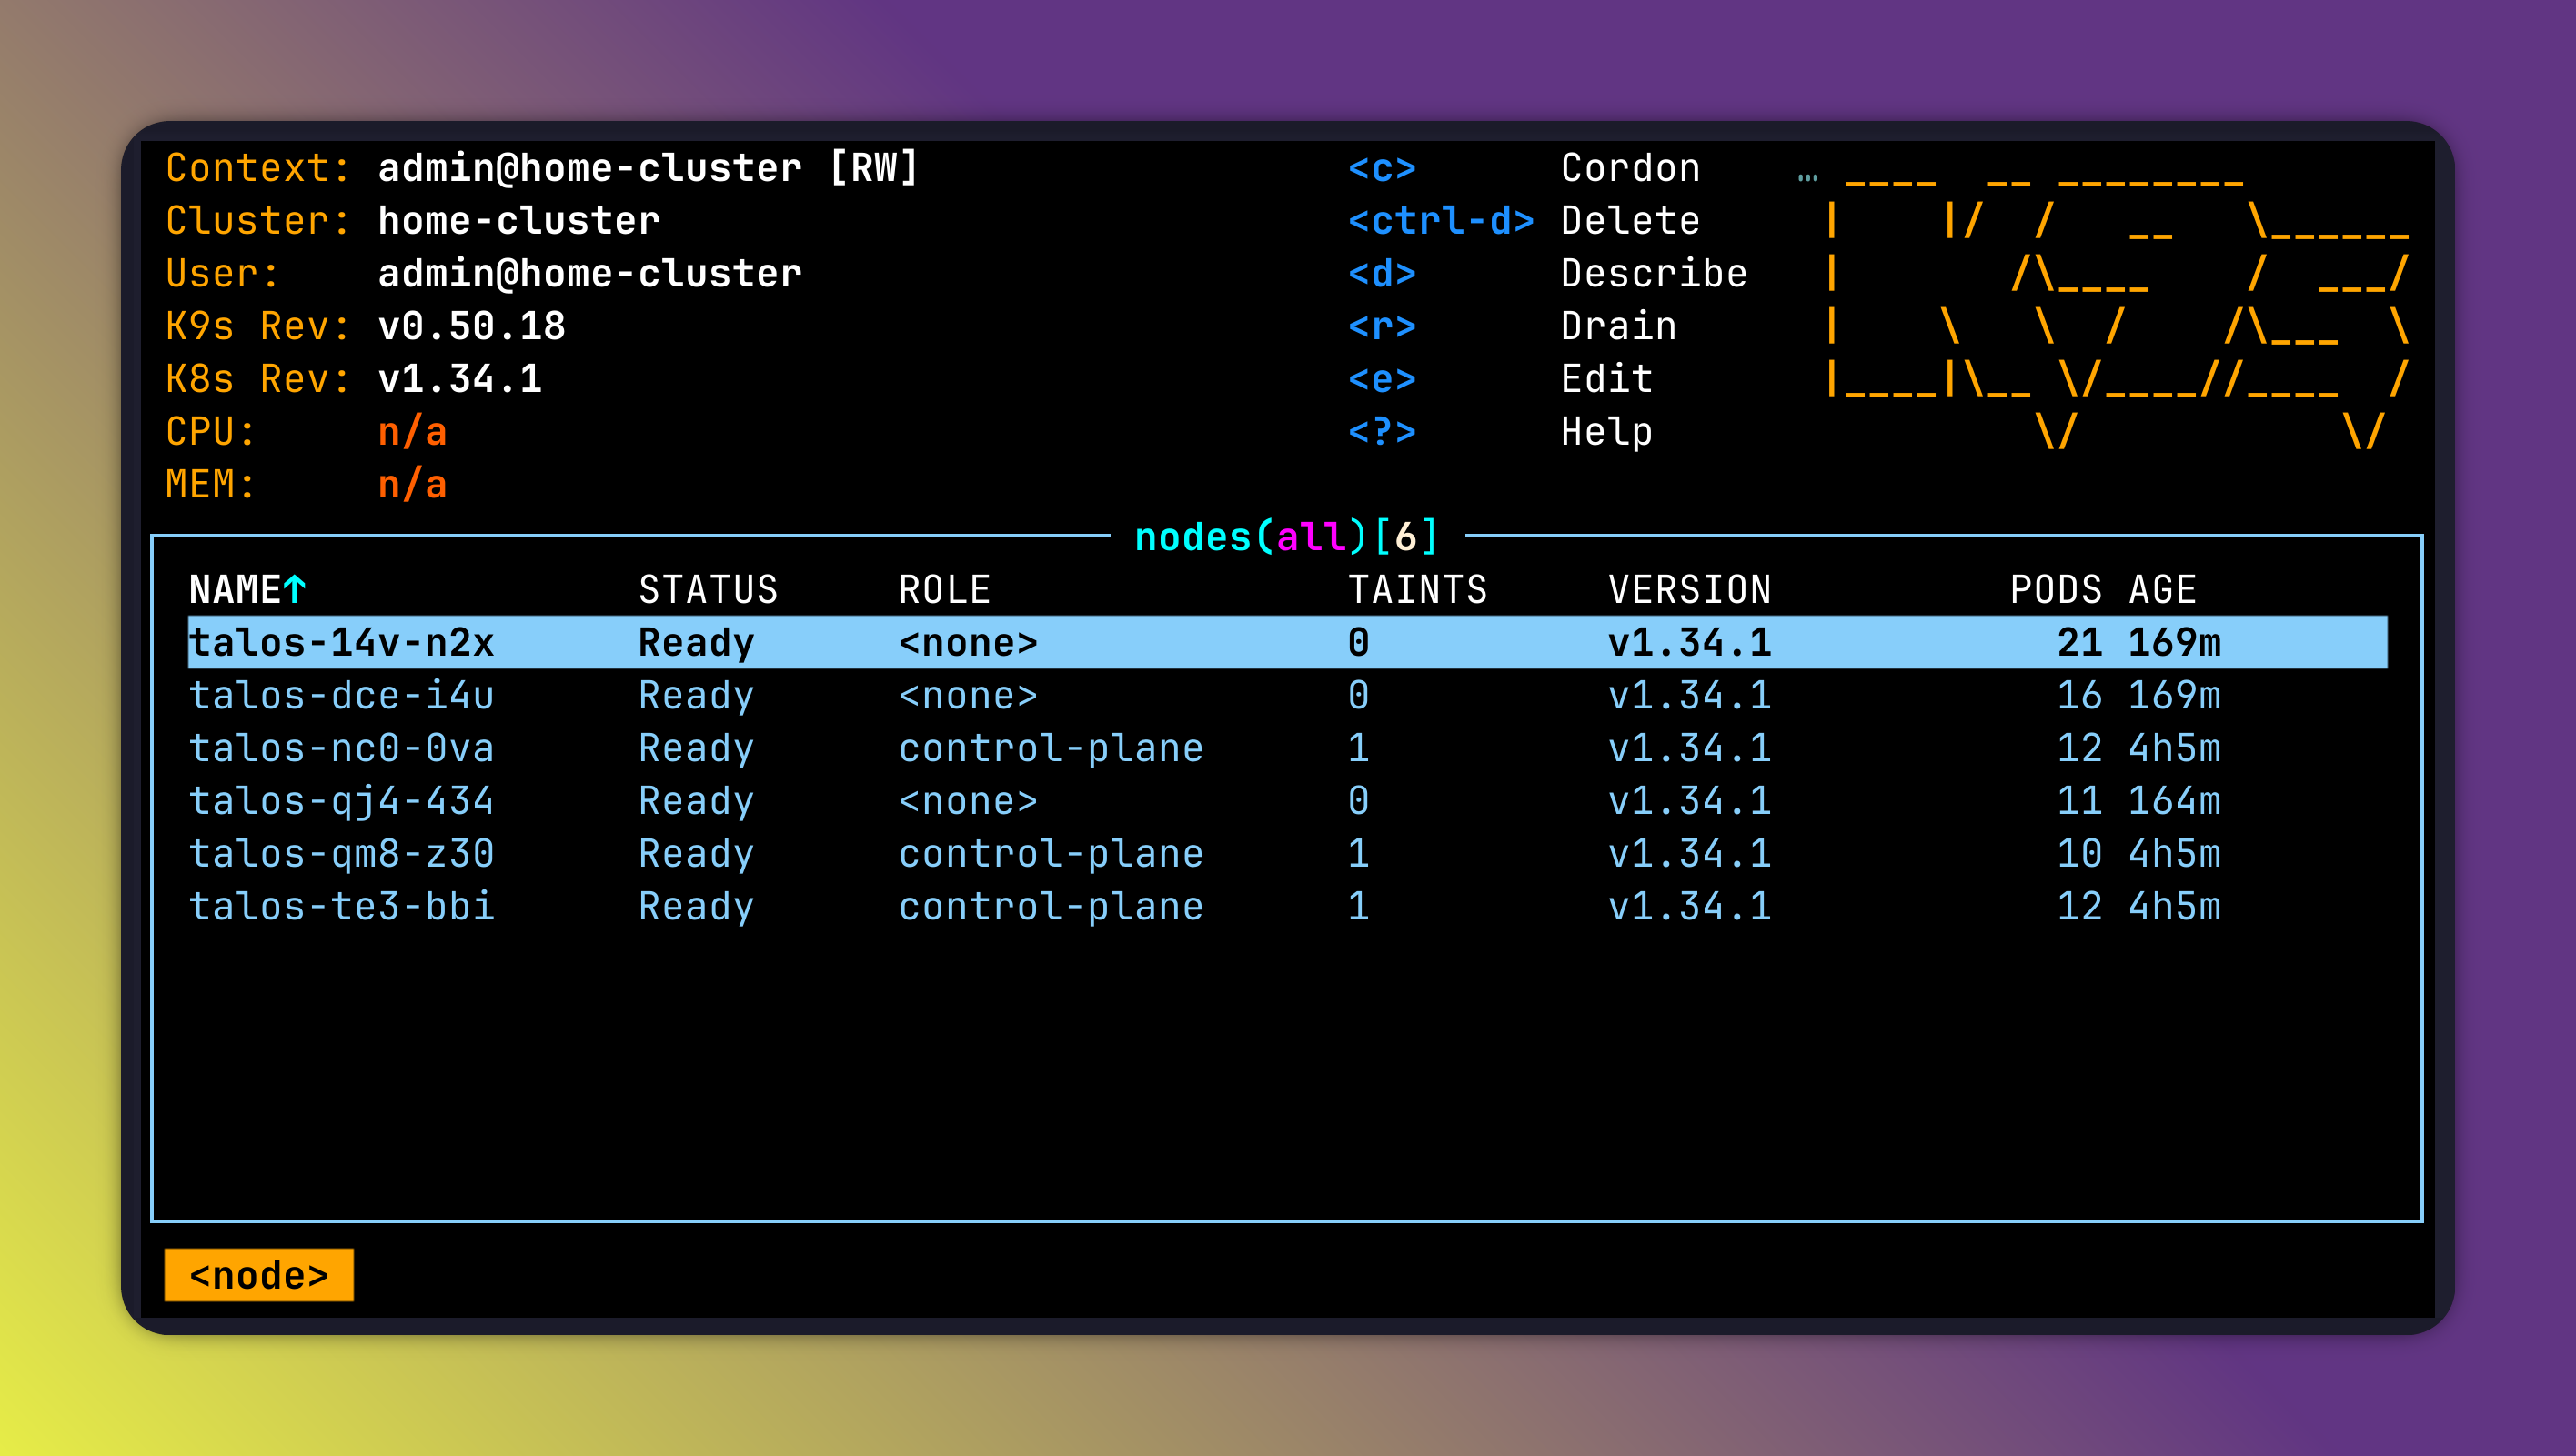
Here is the node view from k9s
Deployment
To manage deployments to the cluster, I use FluxCD for gitops. It reconciles all the configuration that I put in a Forgejo repository. It is organised so that each folder holds an app.
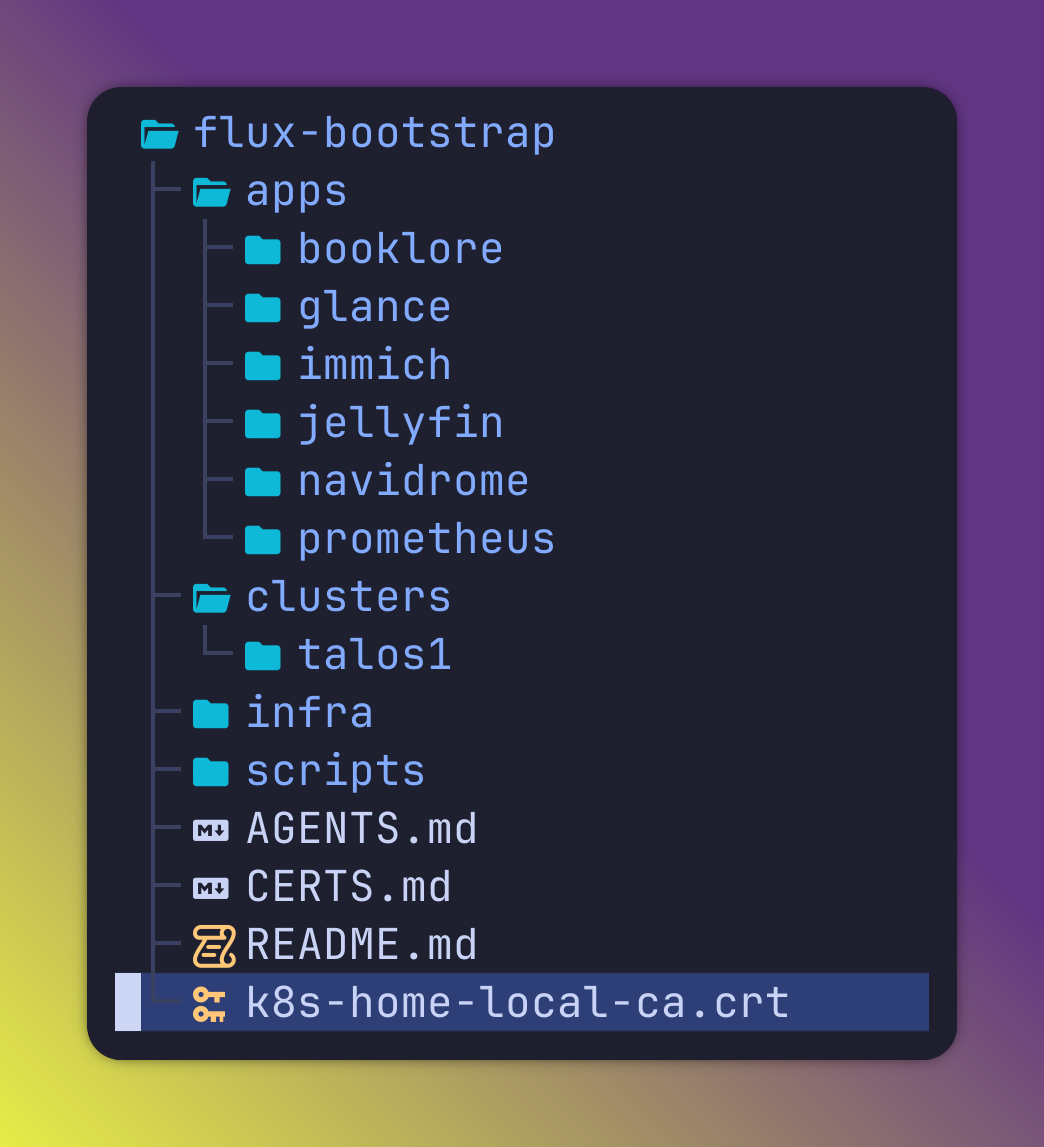
Everything that is not an app is deployed in the infra folder.
To avoid race condition errors, there are 2 separate flux reconciliations - first the infra - then the apps
Storage
I have 2 main CSIs a Read only to the NFS drives on my NAS, to access media, and RWX to Ceph fs for all other PVCs.
This allows to have resilient storage, and most important, to not rely on any local node storage, so that all pods can move to any node and have access to their persistant volumes.
I don't yet have databases on the cluster, I plan to add CNPG for PostgreSQL dbs, but I would have to make some room on the cluster.
Ingress
To expose applications, I use kubernetes Gateway API. I use a fixed IP, and add the wildcard dns entry *.k8s.home.com to it.
flowchart TD
subgraph UDR7
 wild[A *.k8s.home.com 10.0.0.80]
end
subgraph Kubernetes Cluster
  metallb
  Gateway
  http1[HttpRoute glance.k8s.home.com]
  http2[HttpRoute jellyfin.k8s.home.com]
end
metallb --> |allocate ip & load balance| Gateway
wild --> |resolves to| Gateway
Gateway --> |redirects| http1
Gateway --> |redirects| http2
# Gateway definition
apiVersion: gateway.networking.k8s.io/v1
kind: Gateway
metadata:
name: cluster-gateway
namespace: default
annotations:
io.cilium/lb-ip-address: "10.0.0.80"
spec:
gatewayClassName: cilium
listeners:
- name: https
protocol: HTTPS
port: 443
tls:
mode: Terminate
certificateRefs:
- kind: Secret
name: cluster-gateway-tls
allowedRoutes:
namespaces:
from: Same
The load balancing and Gateway IP allocation is handled by metallb.
#MetalLb config
apiVersion: metallb.io/v1beta1
kind: IPAddressPool
metadata:
  name: primary-pool
  namespace: kube-system
spec:
  addresses:
    - 10.0.0.80-10.0.0.90
---
apiVersion: metallb.io/v1beta1
kind: L2Advertisement
metadata:
  name: main-advertisement
  namespace: kube-system
spec:
  ipAddressPools:
    - primary-pool
HTTP routes are signed by a self signed certificate provided by cert-manager, this root ca is added to all my personal devices. This certificate signs all *.k8s.home.com endpoints.
Even though I have several Route53 DNS zones, I didn't want to rely on external DNS challenge and LetsEncrypt for the kubernetes hosted apps.
The cert-manager deployment
apiVersion: source.toolkit.fluxcd.io/v1beta2
kind: HelmRepository
metadata:
  name: cert-manager
  namespace: flux-system
spec:
  interval: 1h
  url: https://charts.jetstack.io
---
apiVersion: helm.toolkit.fluxcd.io/v2
kind: HelmRelease
metadata:
  name: cert-manager
  namespace: flux-system
spec:
  interval: 5m
  releaseName: cert-manager
  targetNamespace: cert-manager
  install:
    createNamespace: true
Applications
Let's start by the apps hosted on kubernetes.
The main app I run is Glance, that serves as a homepage to access my other applications. And has news on the public stuff I follow (steam sales, twitch, youtube,...)
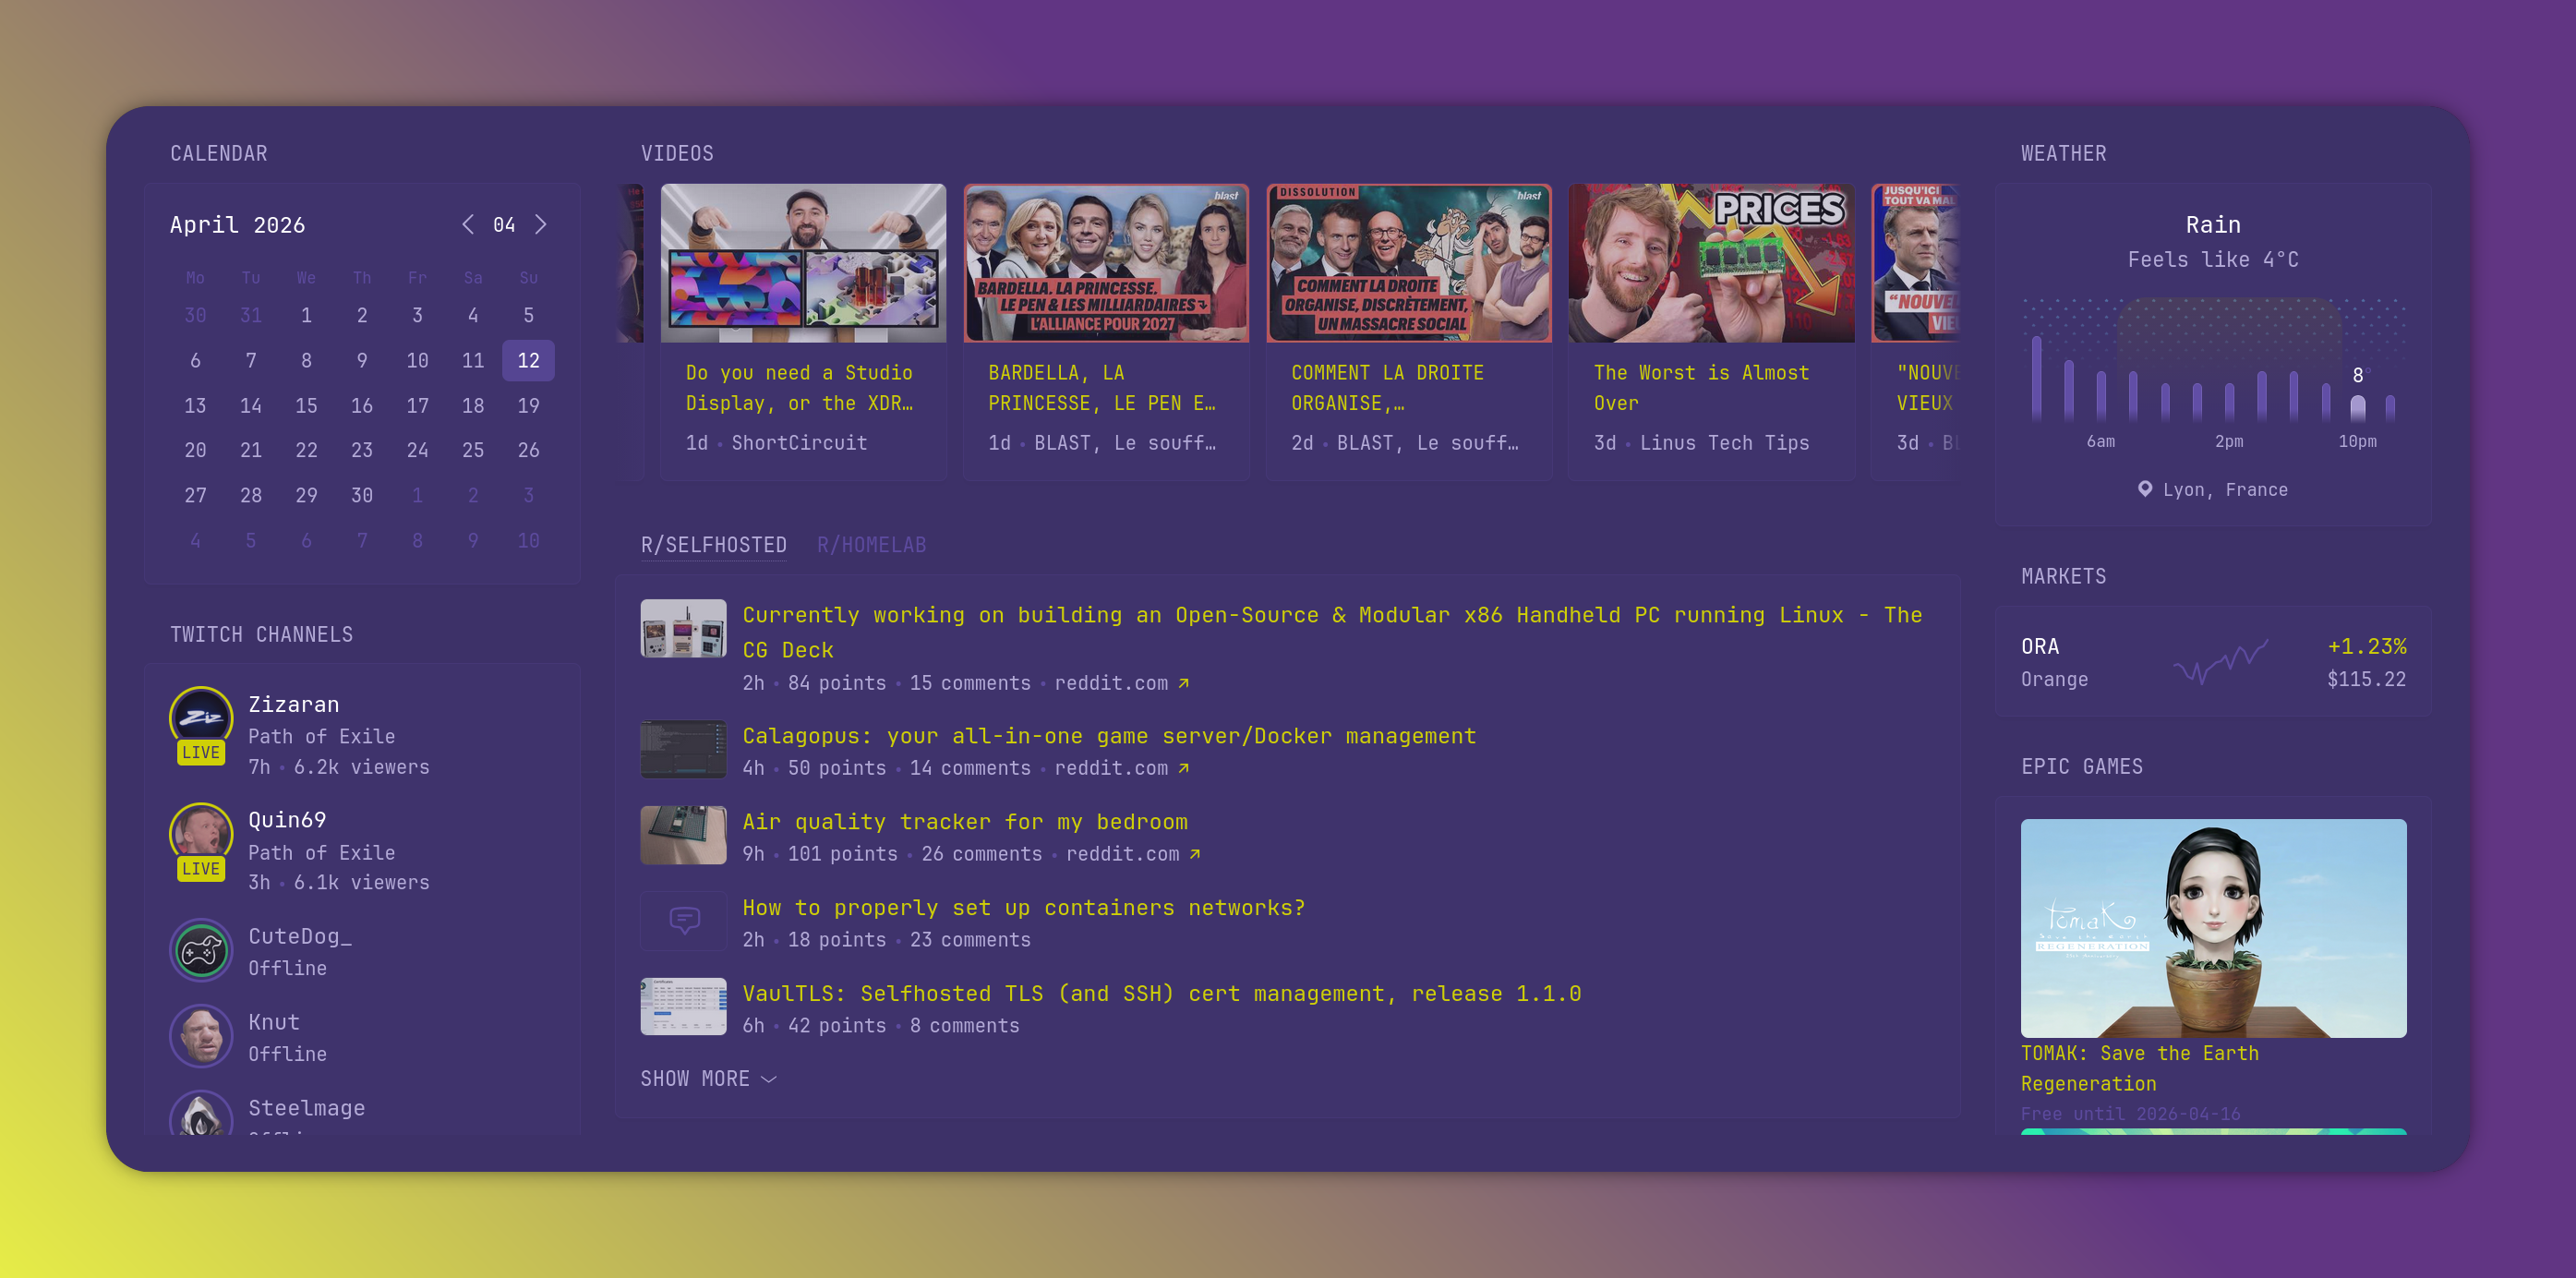
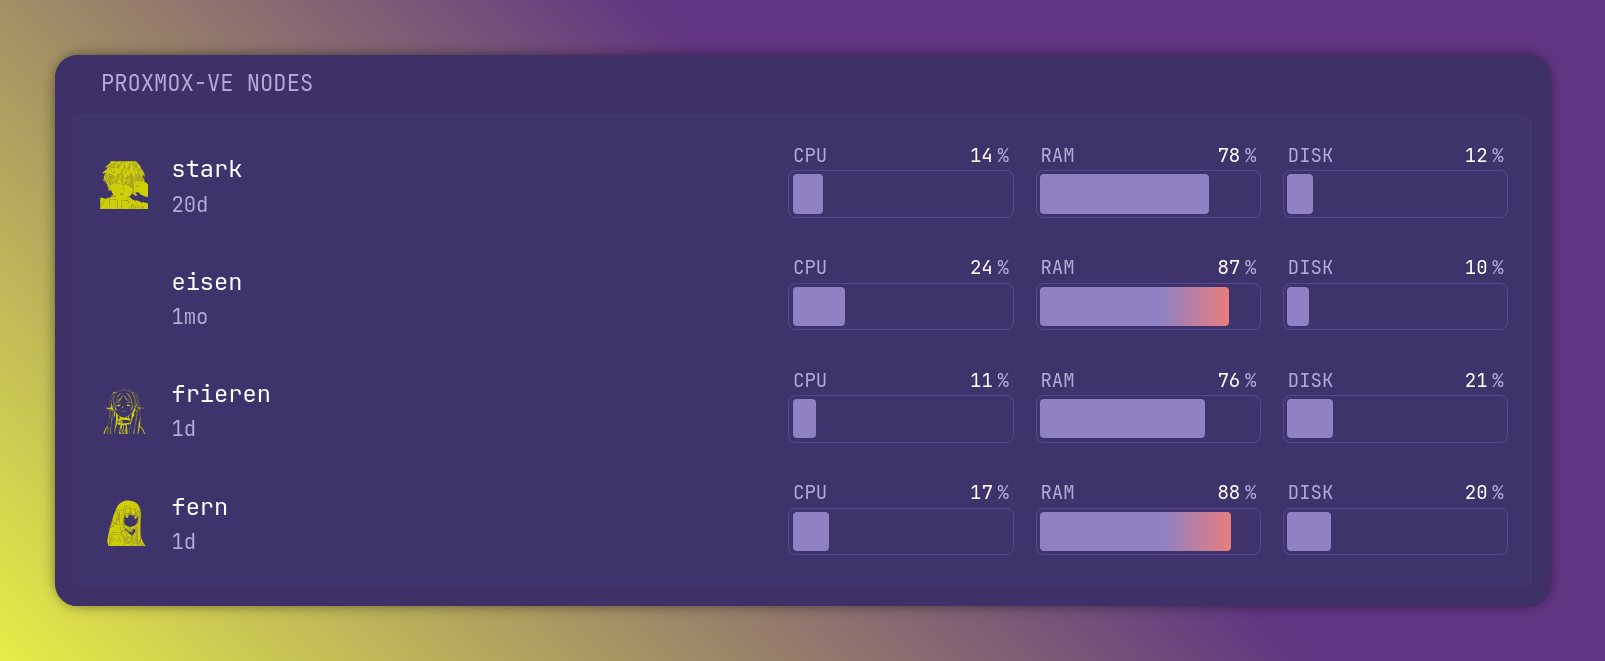
as well as proxmox nodes statuses
I then have different media apps, they all point to a NFS volume depending on the media type.
- Jellyfin : movies and tv shows
- Navidrome : music
- Booklore : eBooks
I don't have anything dedicated to podcasts as I don't follow any.
I then have two apps that run as VM on the synology nas directly, as this is where I started and never moved them to proxmox. - Home Assistant - Kiwix (local copy of wikipedia and other wikis)
The last app I run, that is not yet in kubernetes but only on the docker host is a Vaultwarden, to serve my secrets locally, I use Bitwarden as my main secret manager, the Vaultwarden hosts a copy of Bitwarden, that I sync manually once in a while.
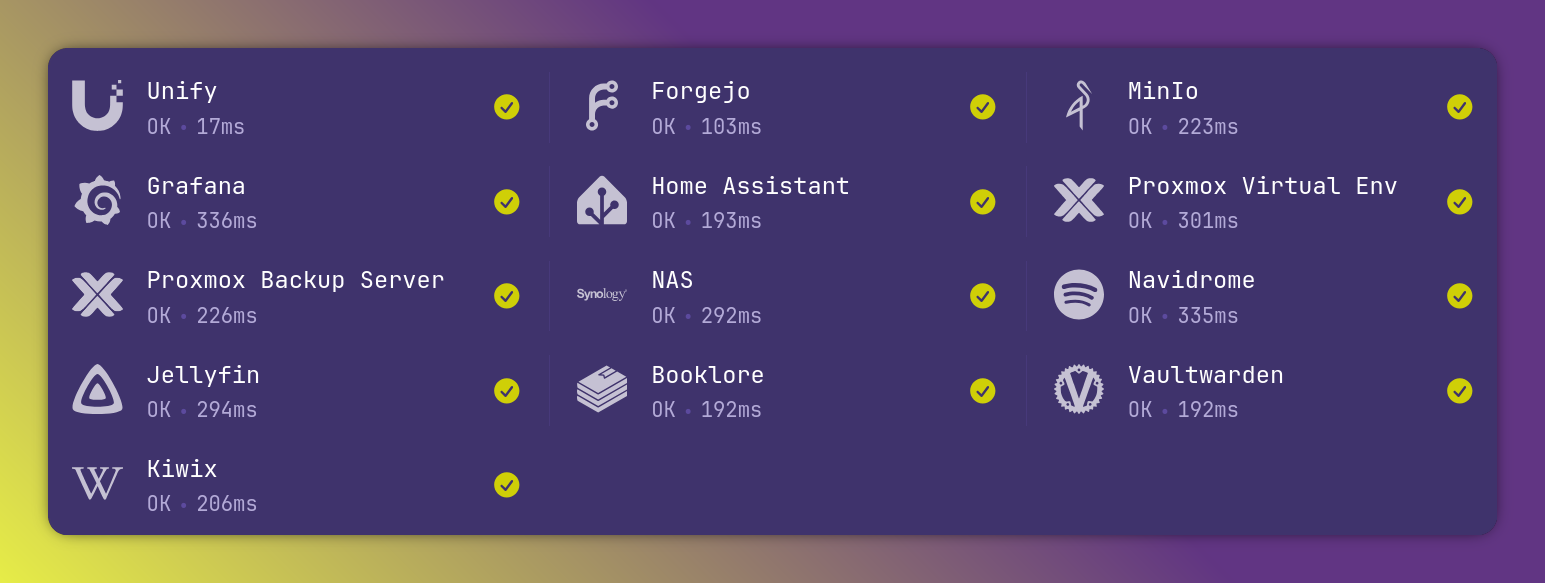
Glance centralizes those apps as well as giving me a health status.
Monitoring - Grafana
My current monitoring stack is a bit resource-hungry for the size of my infra. This is why I monitor only metrics at the moment and no logs.
flowchart
subgraph Proxmox
subgraph Docker
 influxdb
end
subgraph Kubernetes
prometheus
Grafana
end
PVEmetrics
end
PVEmetrics --> |send metrics| influxdb
Grafana --> |reads| prometheus
Grafana --> |reads| influxdb
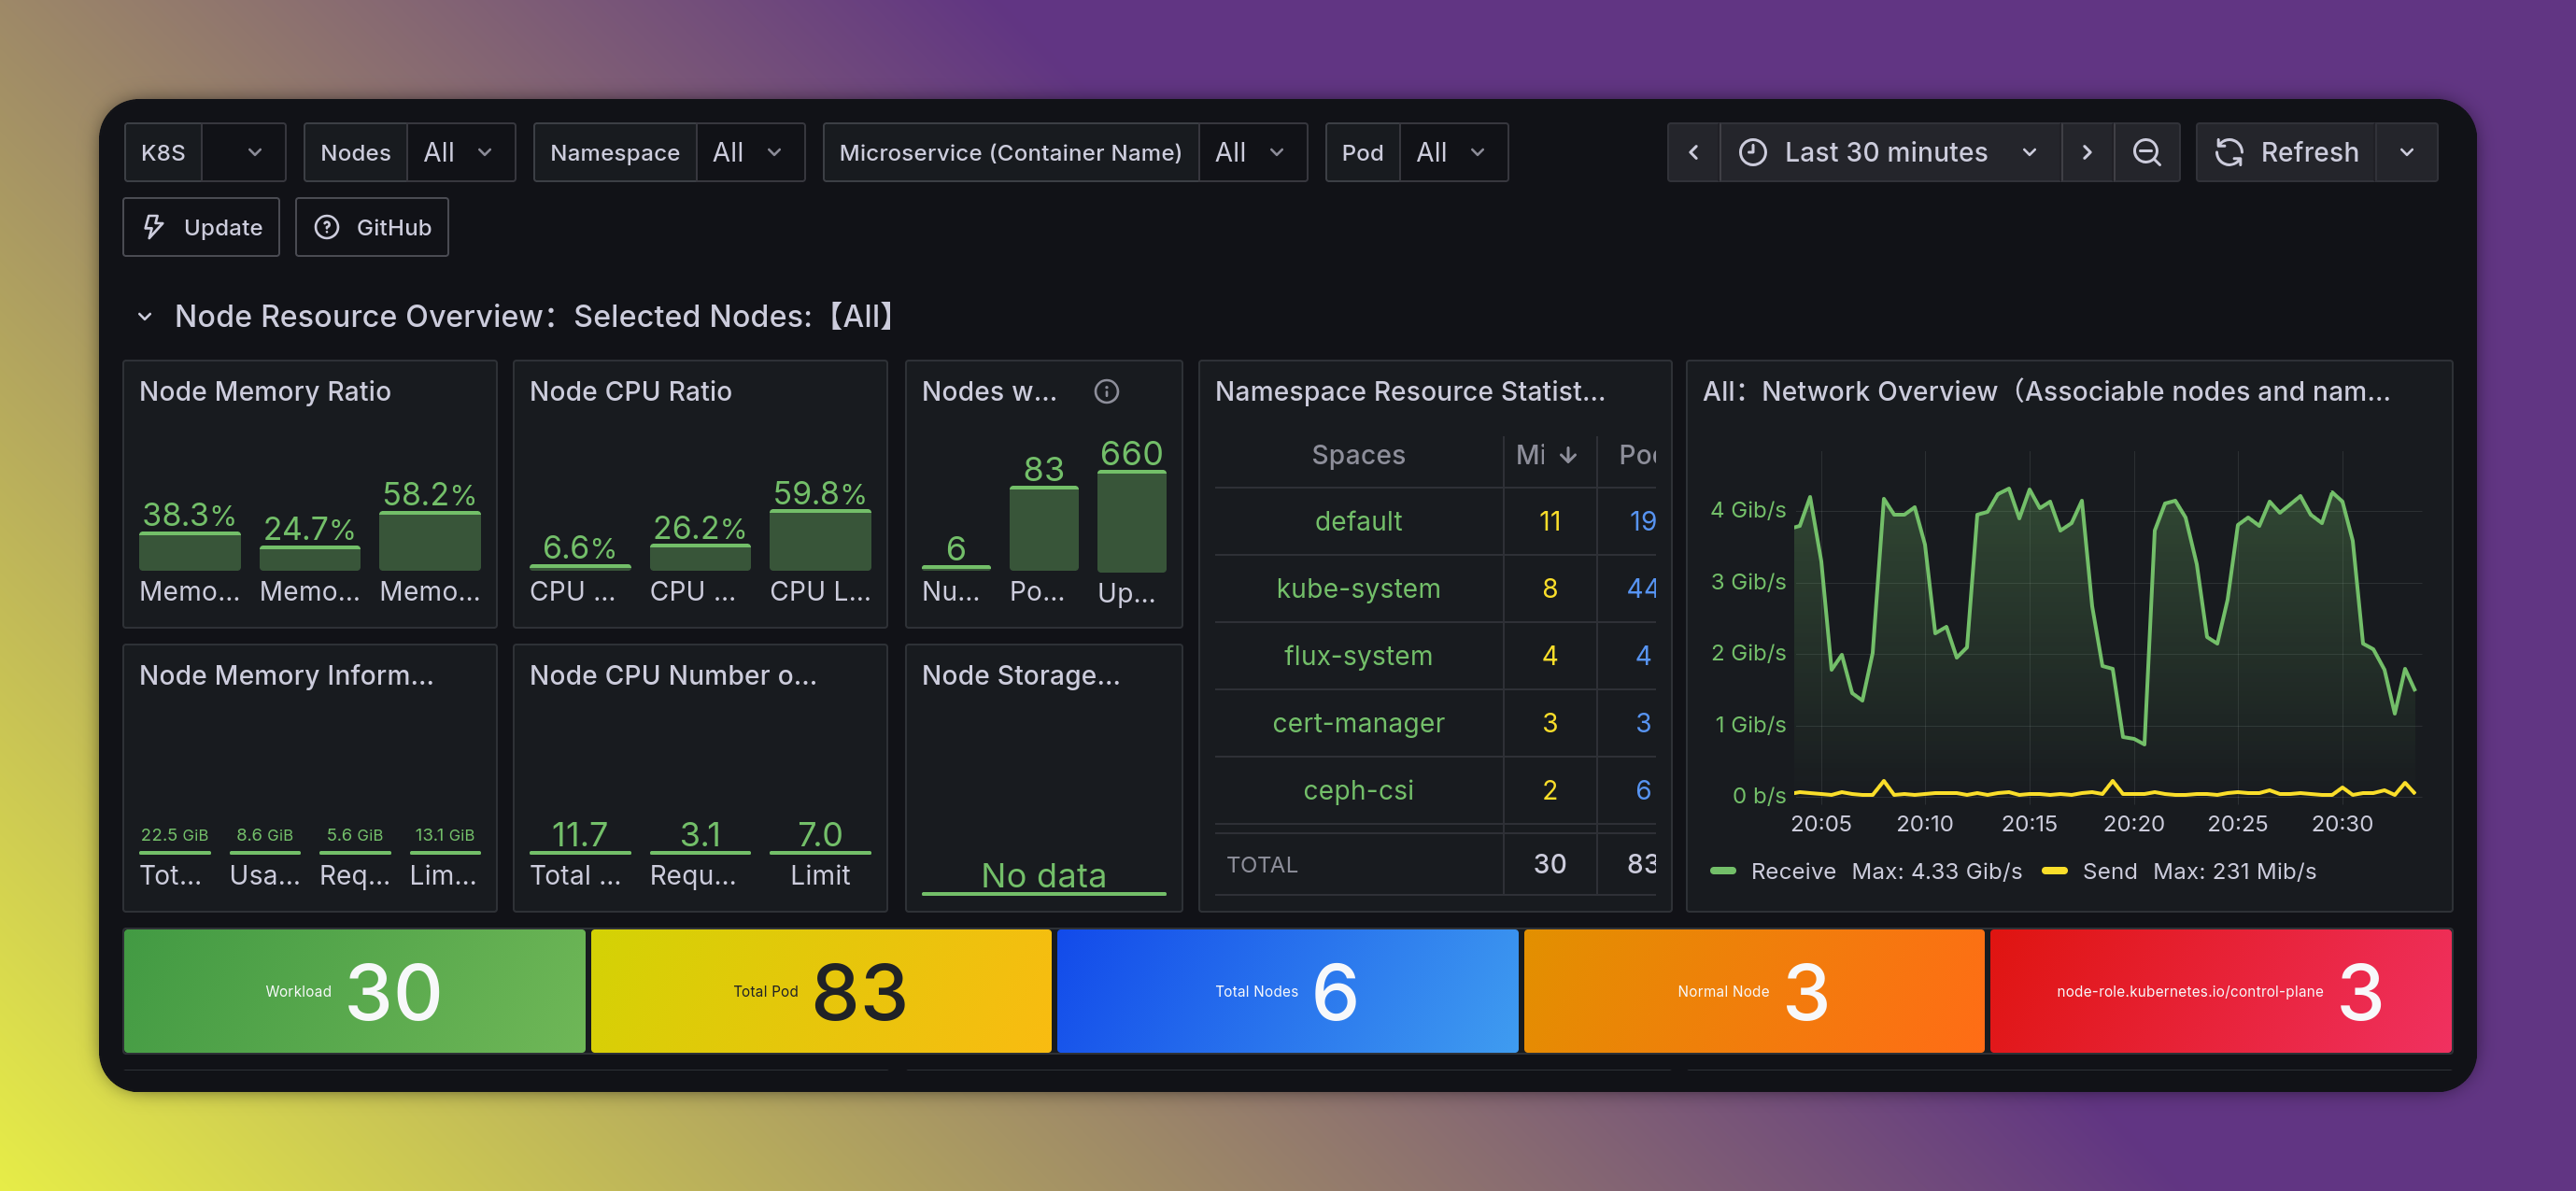
Within the kubernetes cluster, I host a Grafana, and have a prometheus node exporter that fetches metrics from all the nodes.
To monitor proxmox, and retain long time metrics, I set up an InfluxDB on the docker vm, and configured standard proxmox ve metrics export to it.
Grafana then has dashboards using the 2 sources, Prometheus and InfluxDB.
This is not an ideal setup, because if I lose Grafana or kubernetes I lose access to the underlying proxmox monitoring, but I had to make compromises, as my homelab resources are finite.
PS
Wile writing this, i had the great idea to switch my proxmox network size from /10 to /24, to make some space.
Issue is, that meant my talos nodes had to get ips in the new range. And i didnt think to do it prior to the subnet size change.
The 3 control plane nodes lost track of their etcd, and i got a split brained cluster, i spent 4 hours putting every thing back together with an etcd snapshot.
This explains why some uptime are so fresh in the screenshots ^^
TLDR : backup your stuff.